Warehouse Statistics by State: U.S. Establishments, Jobs, Pay and Growth
By Columbus Dock Door Repair Research · Published and last updated · Data last verified · Final 2024 annual data · Dataset version 1.0
These figures cover private-sector 2022 NAICS 493, Warehousing and Storage. They measure industry reporting establishments and filled payroll jobs, not physical warehouse buildings, warehouse square footage, unique workers, or everyone employed in a warehouse occupation.
| Rank | Area | Establishments | Covered Jobs | Avg. Annual Pay | Job Change | Job Growth | Employment LQ |
|---|---|---|---|---|---|---|---|
| — | United States | 22,757 | 1,892,154 | $55,896 | +31,563 | +1.7% | 1.00 |
| 1 | California | 2,685 | 243,656 | $68,149 | −2,653 | −1.1% | 1.10 |
| 2 | Texas | 2,053 | 169,621 | $55,329 | +1,974 | +1.2% | 1.00 |
| 3 | Pennsylvania | 1,139 | 122,432 | $56,011 | +2,179 | +1.8% | 1.67 |
| 4 | Florida | 1,208 | 101,529 | $52,404 | +3,343 | +3.4% | 0.85 |
| 5 | Ohio | 974 | 95,450 | $51,210 | +3,964 | +4.3% | 1.42 |
Source: our analysis of final 2024 U.S. Bureau of Labor Statistics Quarterly Census of Employment and Wages data, filtered to private ownership and 2022 NAICS 493. Linked state names open the corresponding official BLS annual area file.
Several findings matter beyond the individual leaderboards:
- California and Texas together accounted for 21.84% of national private 2022 NAICS 493 jobs and 20.82% of establishments.
- The five largest disclosed state totals accounted for 38.72% of U.S. jobs; the ten largest accounted for 58.57%.
- Among the 49 jurisdictions with disclosed employment-change values, 33 gained jobs and 16 lost jobs.
- Four disclosed states had at least 100,000 covered jobs, and 13 had at least 50,000.
- Sixteen disclosed states had an employment location quotient above 1.00, one equaled 1.00, and 32 were below 1.00.
Those numbers are calculated from the versioned dataset, not copied from another statistics roundup.
Data files:
51-jurisdiction CSV·data dictionary·source manifest·QA report·analysis script·SHA-256 checksum
Columbus Dock Door Repair Research is the independent research and reference section of ColumbusDockDoorRepair.com.
What do warehouse statistics by state show in 2024?
Final 2024 data show that the private U.S. industry classified under 2022 NAICS 493 averaged 1.89 million covered jobs, $105.76 billion in annual wages, and 22,757 establishments. The headline changes with the metric: California led disclosed scale, New York led disclosed absolute job gains, Louisiana led disclosed percentage growth, New Hampshire led disclosed average pay, and Nevada led disclosed employment concentration.
| National measure | Final 2024 value | 2023–2024 change |
|---|---|---|
| Annual-average establishments | 22,757 | +708 (+3.2%) |
| Annual-average covered jobs | 1,892,154 | +31,563 (+1.7%) |
| Total annual wages | $105,763,260,248 | — |
| Average annual pay | $55,896 | +$4,031 (+7.8%) |
| Average weekly pay | $1,075 | — |
| Jobs per establishment | 83.15 | −1.47% from the implied 2023 ratio |
Source: official BLS U.S. annual area row; jobs per establishment and its prior-year comparison are our calculations from BLS-published annual levels and changes.
| Measure | 2024 disclosed leader | Value | Context |
|---|---|---|---|
| Covered jobs | California | 243,656 | 12.88% of the U.S. total |
| Establishments | California | 2,685 | 11.80% of the U.S. total |
| Absolute job gain | New York | +4,718 | 53,912 jobs in 2023 to 58,630 in 2024 |
| Percentage job growth | Louisiana | +54.6% | 7,986 jobs in 2023 to 12,344 in 2024 |
| Average annual pay | New Hampshire | $89,023 | Across 3,371 covered industry jobs |
| Employment concentration | Nevada | 2.33 LQ | More than twice the national industry share |
| Jobs per establishment | Arizona | 148.8 | Derived reporting-unit ratio, not building headcount |
Source: our disclosure-aware comparison of the complete 51-jurisdiction dataset. Values originate in the corresponding official BLS state files; context fields are calculated from the same release.
What does this warehouse dataset measure—and what does it not measure?
This report measures private establishments whose predominant activity is Warehousing and Storage under 2022 NAICS 493, together with their covered payroll jobs, wages, pay, concentration, and annual change. It does not count warehouse buildings, warehouse occupations, square footage, capacity, vacancy, revenue, or unique workers.
| Measure | What it means here | What it does not mean |
|---|---|---|
| Establishments | Annual average of quarterly QCEW reporting units classified in private 2022 NAICS 493 | A definitive inventory of warehouse buildings, parcels, companies, or map listings |
| Employment | Annual average of filled payroll jobs at those establishments, by place of work | Unique people or everyone working in a warehouse occupation |
| Pay | Total annual wages divided by annual-average employment across all jobs in the industry | A median salary, an hourly warehouse-worker wage, or a cost-of-living-adjusted measure |
| Growth | The BLS-published 2023–2024 change in annual-average jobs or establishments | Proof that a particular project, policy, employer, or technology caused the change |
| Location quotient | The state industry share of employment relative to the national industry share | Warehouse capacity, productivity, square footage, vacancy, throughput, or market quality |
| Industry scope | General, refrigerated, farm-product, and other warehousing and storage under 2022 NAICS 493 | Self-storage leasing, wholesale trade, couriers, trucking, or incidental storage |
Source: measurement framework created for this report from the Census Bureau’s 2022 NAICS 493 definition and the BLS QCEW definitions and questions.
The U.S. Census Bureau defines 2022 NAICS 493 as establishments primarily operating facilities that store general merchandise, refrigerated goods, farm products, and other goods. These establishments can also perform logistics work such as inventory control, order fulfillment, packaging, pick-and-pack, labeling, light assembly, and transportation arrangement—but warehousing or storage must remain a substantive service.
Self-storage is outside this scope. The Census Bureau classifies renting or leasing self-storage space under NAICS 531130, Lessors of Miniwarehouses and Self-Storage Units, rather than NAICS 493110.
This report compares annual-average private 2022 NAICS 493 reporting establishments and covered jobs by state; it does not estimate the number of physical warehouse buildings.
How was the state dataset built and verified?
We retrieved 52 official BLS annual area files, applied one identical filter, retained 51 state-and-D.C. records, and used the national row as a control rather than rebuilding the U.S. total from visible state values. We preserved disclosure codes, kept agency-published fields separate from our calculations, and recorded a SHA-256 checksum for the released CSV.
| Verification item | Result | Interpretation |
|---|---|---|
| Official source files retrieved | 52 | 50 states, the District of Columbia, and one U.S. control row |
| Published jurisdiction rows | 51 | All 50 states plus D.C. |
| Exact filter | year=2024 · qtr=A · own=5 · industry=493 · size=0 | Final annual average, private ownership, all establishment sizes |
| Jurisdictions with disclosed employment and pay | 49 | D.C. and Hawaii are marked ND rather than zero |
| Visible state/D.C. job sum | 1,890,972 | 1,182 below the official U.S. total |
| Official U.S. job total | 1,892,154 | Includes undisclosed components |
| Visible state/D.C. establishment sum | 22,755 | 2 below the official U.S. total |
| Dataset SHA-256 | dd77b27b50e32ef2789571428b2e91529f33b1840fbc6f158b106e04f311a2ed | Version 1.0 integrity check |
Source: the version 1.0 source manifest, QA report, and official BLS open-data documentation.
The exact extraction
We selected the annual record in each area file using the same five conditions:
- Year: 2024.
- Quarter:
A, the annual-average record. - Ownership:
5, private. - Industry:
493, Warehousing and Storage. - Size:
0, all establishment sizes.
BLS describes its open data as complete CSV slices by area, industry, and size class. The broader QCEW program covered 97.2% of employees on nonfarm payrolls in 2024; this report then narrows that universe to private 2022 NAICS 493. BLS describes the 2024 annual bulletin as complete and final.
Agency-published fields and our calculated fields
The BLS source files provide annual-average establishments, annual-average employment, total wages, average weekly and annual pay, location quotients, over-the-year changes, and disclosure codes. We calculated only the following additional fields:
| Calculated field | Formula |
|---|---|
| Jobs per establishment | annual-average employment ÷ annual-average establishments |
| State share of U.S. jobs | state employment ÷ official U.S. employment × 100 |
| State share of U.S. establishments | state establishments ÷ official U.S. establishments × 100 |
| Prior-year employment | 2024 employment − BLS-published employment change |
| Prior-year establishments | 2024 establishments − BLS-published establishment change |
| State positions | descending rank among disclosed jurisdictions for the selected measure |
Source: formulas defined for this report and implemented in the published analysis script. The input values are from final 2024 BLS QCEW area files.
How suppressed data were handled
BLS uses an N disclosure code when publication could expose identifiable employer information. In those records, establishment counts remain public, while suppressed employment and wage fields are zero-filled in the raw file; affected non-establishment location quotients and over-the-year fields are also zero-filled, but establishment-count location quotients and establishment over-the-year changes remain available. BLS explicitly documents this convention.
We converted the protected employment, wage, and dependent non-establishment fields to ND, meaning not disclosed. D.C. and Hawaii therefore retain their annual-average establishment counts—23 and 56—while unavailable employment, wage, and dependent measures are excluded from state comparisons rather than treated as observed zeros.
Primary sources and audit files
How many warehouse establishments and jobs are in each state?
California had the most disclosed private 2022 NAICS 493 jobs in 2024, while D.C. and Hawaii had protected employment values and are shown as ND. The table gives all 50 states and D.C. under one final annual definition, with each state name opening the exact official BLS source file used for that row.
| Rank | State or area | Estab. | Covered jobs | Avg. annual pay | Job change | Growth | LQ | Jobs/estab. |
|---|---|---|---|---|---|---|---|---|
| — | United States | 22,757 | 1,892,154 | $55,896 | +31,563 | +1.7% | 1.00 | 83.1 |
| 1 | California | 2,685 | 243,656 | $68,149 | −2,653 | −1.1% | 1.10 | 90.7 |
| 2 | Texas | 2,053 | 169,621 | $55,329 | +1,974 | +1.2% | 1.00 | 82.6 |
| 3 | Pennsylvania | 1,139 | 122,432 | $56,011 | +2,179 | +1.8% | 1.67 | 107.5 |
| 4 | Florida | 1,208 | 101,529 | $52,404 | +3,343 | +3.4% | 0.85 | 84.0 |
| 5 | Ohio | 974 | 95,450 | $51,210 | +3,964 | +4.3% | 1.42 | 98.0 |
| 6 | Georgia | 1,056 | 92,588 | $50,764 | −1,261 | −1.3% | 1.56 | 87.7 |
| 7 | Illinois | 858 | 79,921 | $55,411 | +292 | +0.4% | 1.08 | 93.1 |
| 8 | New Jersey | 915 | 76,866 | $54,847 | −2,884 | −3.6% | 1.48 | 84.0 |
| 9 | Indiana | 546 | 67,598 | $51,865 | +2,795 | +4.3% | 1.74 | 123.8 |
| 10 | New York | 780 | 58,630 | $61,178 | +4,718 | +8.8% | 0.49 | 75.2 |
| 11 | Tennessee | 670 | 54,954 | $57,413 | +3,681 | +7.2% | 1.38 | 82.0 |
| 12 | North Carolina | 594 | 54,271 | $50,640 | +1,677 | +3.2% | 0.91 | 91.4 |
| 13 | Arizona | 353 | 52,515 | $49,395 | +778 | +1.5% | 1.33 | 148.8 |
| 14 | Nevada | 610 | 44,084 | $50,657 | −699 | −1.6% | 2.33 | 72.3 |
| 15 | Virginia | 490 | 43,901 | $57,225 | +3,480 | +8.6% | 0.88 | 89.6 |
| 16 | Michigan | 551 | 41,144 | $58,884 | +1,612 | +4.1% | 0.76 | 74.7 |
| 17 | Kentucky | 424 | 39,228 | $53,540 | −1,093 | −2.7% | 1.62 | 92.5 |
| 18 | Maryland | 247 | 34,028 | $47,936 | −576 | −1.7% | 1.01 | 137.8 |
| 19 | Washington | 478 | 33,255 | $61,344 | +2,062 | +6.6% | 0.76 | 69.6 |
| 20 | Wisconsin | 421 | 32,207 | $52,278 | +15 | 0.0% | 0.90 | 76.5 |
| 21 | South Carolina | 509 | 27,067 | $53,351 | −1,172 | −4.2% | 0.97 | 53.2 |
| 22 | Missouri | 510 | 26,687 | $52,312 | +840 | +3.2% | 0.75 | 52.3 |
| 23 | Mississippi | 304 | 25,736 | $48,018 | +1,119 | +4.5% | 1.81 | 84.7 |
| 24 | Colorado | 299 | 25,718 | $62,249 | +1,359 | +5.6% | 0.73 | 86.0 |
| 25 | Connecticut | 188 | 24,960 | $51,139 | +645 | +2.7% | 1.21 | 132.8 |
| 26 | Alabama | 311 | 23,678 | $49,591 | −1,075 | −4.3% | 0.92 | 76.1 |
| 27 | Kansas | 288 | 21,551 | $50,025 | −506 | −2.3% | 1.24 | 74.8 |
| 28 | Oklahoma | 186 | 20,140 | $45,180 | −1,251 | −5.8% | 0.97 | 108.3 |
| 29 | Iowa | 332 | 18,930 | $52,822 | +959 | +5.3% | 0.99 | 57.0 |
| 30 | Oregon | 286 | 17,663 | $59,329 | −139 | −0.8% | 0.73 | 61.8 |
| 31 | Minnesota | 316 | 17,299 | $59,385 | +502 | +3.0% | 0.48 | 54.7 |
| 32 | Massachusetts | 234 | 14,949 | $72,661 | +358 | +2.5% | 0.34 | 63.9 |
| 33 | Arkansas | 211 | 14,078 | $46,783 | +452 | +3.3% | 0.89 | 66.7 |
| 34 | Delaware | 127 | 12,384 | $50,132 | −131 | −1.0% | 2.13 | 97.5 |
| 35 | Louisiana | 326 | 12,344 | $61,969 | +4,358 | +54.6% | 0.53 | 37.9 |
| 36 | Utah | 277 | 11,814 | $60,614 | −241 | −2.0% | 0.56 | 42.6 |
| 37 | Nebraska | 157 | 8,519 | $50,235 | +852 | +11.1% | 0.68 | 54.3 |
| 38 | New Mexico | 66 | 5,261 | $43,592 | +352 | +7.2% | 0.50 | 79.7 |
| 39 | West Virginia | 102 | 3,845 | $46,649 | −157 | −3.9% | 0.45 | 37.7 |
| 40 | Maine | 72 | 3,839 | $58,021 | +1 | 0.0% | 0.48 | 53.3 |
| 41 | New Hampshire | 93 | 3,371 | $89,023 | +33 | +1.0% | 0.40 | 36.2 |
| 42 | South Dakota | 43 | 3,043 | $48,083 | +354 | +13.2% | 0.54 | 70.8 |
| 43 | Idaho | 147 | 2,370 | $56,771 | +60 | +2.6% | 0.23 | 16.1 |
| 44 | Rhode Island | 36 | 2,087 | $53,056 | +326 | +18.5% | 0.35 | 58.0 |
| 45 | North Dakota | 62 | 1,912 | $46,287 | −42 | −2.1% | 0.37 | 30.8 |
| 46 | Wyoming | 19 | 1,806 | $50,916 | +6 | +0.3% | 0.52 | 95.1 |
| 47 | Vermont | 42 | 1,141 | $49,308 | −67 | −5.5% | 0.30 | 27.2 |
| 48 | Alaska | 31 | 484 | $56,634 | +135 | +38.7% | 0.12 | 15.6 |
| 49 | Montana | 50 | 418 | $55,392 | +33 | +8.6% | 0.07 | 8.4 |
| — | District of Columbia | 23 | ND | ND | ND | ND | ND | ND |
| — | Hawaii | 56 | ND | ND | ND | ND | ND | ND |
Source: final 2024 BLS QCEW annual area files, private ownership, 2022 NAICS 493, all establishment sizes. Job rank and jobs per establishment are our calculations. ND means the underlying BLS employment or wage input was not disclosed, so dependent measures are also unavailable.
Which states have the most warehouse jobs?
Among disclosed state values, California ranked first with 243,656 annual-average covered jobs, followed by Texas with 169,621 and Pennsylvania with 122,432. The five largest disclosed state totals held 38.72% of national private 2022 NAICS 493 employment, while the ten largest held 58.57%.
| Rank | State | Jobs | U.S. job share | Establishments | Job change | LQ |
|---|---|---|---|---|---|---|
| 1 | California | 243,656 | 12.88% | 2,685 | −2,653 | 1.10 |
| 2 | Texas | 169,621 | 8.96% | 2,053 | +1,974 | 1.00 |
| 3 | Pennsylvania | 122,432 | 6.47% | 1,139 | +2,179 | 1.67 |
| 4 | Florida | 101,529 | 5.37% | 1,208 | +3,343 | 0.85 |
| 5 | Ohio | 95,450 | 5.04% | 974 | +3,964 | 1.42 |
| 6 | Georgia | 92,588 | 4.89% | 1,056 | −1,261 | 1.56 |
| 7 | Illinois | 79,921 | 4.22% | 858 | +292 | 1.08 |
| 8 | New Jersey | 76,866 | 4.06% | 915 | −2,884 | 1.48 |
| 9 | Indiana | 67,598 | 3.57% | 546 | +2,795 | 1.74 |
| 10 | New York | 58,630 | 3.10% | 780 | +4,718 | 0.49 |
Source: final 2024 BLS QCEW annual area files; state shares and ranks are our calculations using the official U.S. denominator of 1,892,154 jobs.
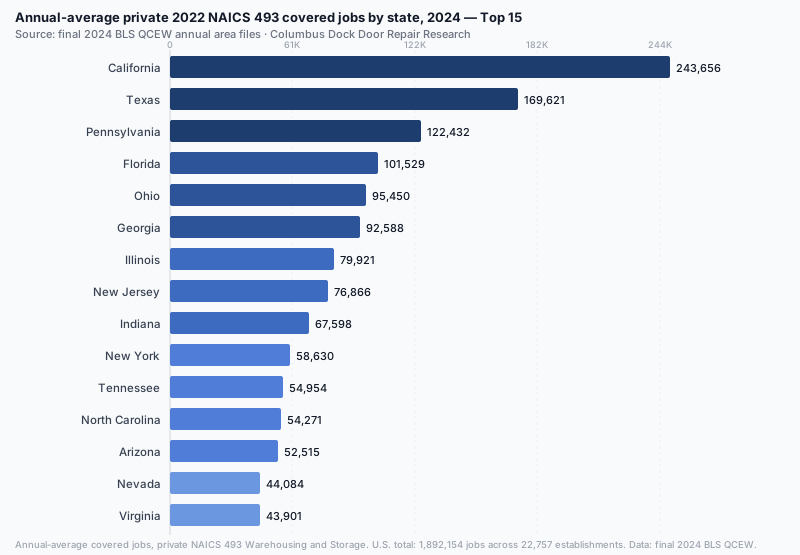
Scale and concentration are different questions. California held 12.88% of national jobs but had an employment location quotient of 1.10, only modestly above the national concentration. Pennsylvania was smaller in absolute terms but much more specialized, with an LQ of 1.67.
Ohio in national context
Ohio ranked fifth in jobs at 95,450, sixth in establishments at 974, and third in absolute job growth after adding 3,964 jobs. Its employment LQ of 1.42 ranked ninth, meaning Warehousing and Storage represented a substantially larger share of Ohio employment than it did nationally.
Which states have the most warehouse establishments?
California averaged 2,685 private 2022 NAICS 493 establishments in 2024, Texas averaged 2,053, and Florida averaged 1,208. California and Texas together represented 20.82% of the national establishment total, while the top ten states represented 54.22%.
| Rank | State | Establishments | U.S. share | Jobs | Estab. change | Estab. growth |
|---|---|---|---|---|---|---|
| 1 | California | 2,685 | 11.80% | 243,656 | +51 | +1.9% |
| 2 | Texas | 2,053 | 9.02% | 169,621 | +96 | +4.9% |
| 3 | Florida | 1,208 | 5.31% | 101,529 | +71 | +6.2% |
| 4 | Pennsylvania | 1,139 | 5.01% | 122,432 | +27 | +2.4% |
| 5 | Georgia | 1,056 | 4.64% | 92,588 | +106 | +11.2% |
| 6 | Ohio | 974 | 4.28% | 95,450 | +71 | +7.9% |
| 7 | New Jersey | 915 | 4.02% | 76,866 | +19 | +2.1% |
| 8 | Illinois | 858 | 3.77% | 79,921 | +2 | +0.2% |
| 9 | New York | 780 | 3.43% | 58,630 | +4 | +0.5% |
| 10 | Tennessee | 670 | 2.94% | 54,954 | +54 | +8.8% |
Source: final 2024 BLS QCEW annual area files; state shares and ranks are our calculations using the official U.S. denominator of 22,757 establishments.
An annual-average establishment count is not a December count. BLS calculates it by adding the four quarterly establishment counts and dividing by four. It is also not a building census: an establishment is usually a worksite, but multi-establishment firms can report in different ways. Georgia stands out in this table for adding 106 establishments, an 11.2% increase—the largest absolute increase among the ten biggest establishment states.
Which states added or lost the most warehouse jobs?
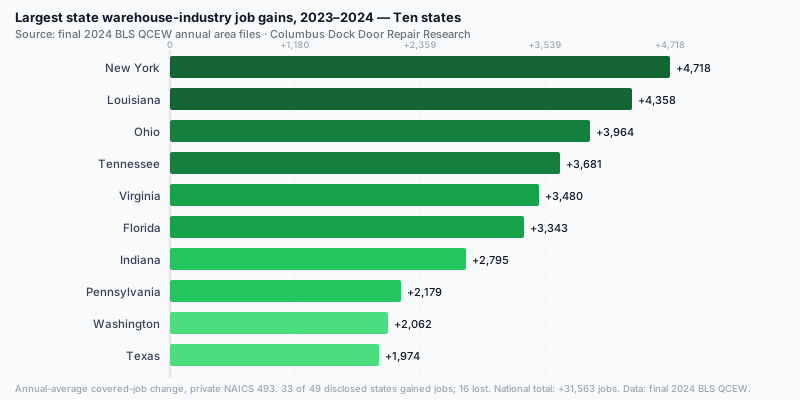
Among the 49 jurisdictions with disclosed employment changes, 33 gained jobs and 16 lost jobs from 2023 to 2024. New York posted the largest absolute gain at 4,718, while New Jersey posted the largest disclosed loss at 2,884.
Ten largest job gains
| Rank | State | 2023 jobs | 2024 jobs | Net change | Growth |
|---|---|---|---|---|---|
| 1 | New York | 53,912 | 58,630 | +4,718 | +8.8% |
| 2 | Louisiana | 7,986 | 12,344 | +4,358 | +54.6% |
| 3 | Ohio | 91,486 | 95,450 | +3,964 | +4.3% |
| 4 | Tennessee | 51,273 | 54,954 | +3,681 | +7.2% |
| 5 | Virginia | 40,421 | 43,901 | +3,480 | +8.6% |
| 6 | Florida | 98,186 | 101,529 | +3,343 | +3.4% |
| 7 | Indiana | 64,803 | 67,598 | +2,795 | +4.3% |
| 8 | Pennsylvania | 120,253 | 122,432 | +2,179 | +1.8% |
| 9 | Washington | 31,193 | 33,255 | +2,062 | +6.6% |
| 10 | Texas | 167,647 | 169,621 | +1,974 | +1.2% |
Source: final 2024 BLS QCEW annual area files. Prior-year employment is reconstructed as 2024 employment minus the BLS-published over-the-year change.
Ten largest job losses
| Rank | State | 2023 jobs | 2024 jobs | Net change | Growth |
|---|---|---|---|---|---|
| 1 | New Jersey | 79,750 | 76,866 | −2,884 | −3.6% |
| 2 | California | 246,309 | 243,656 | −2,653 | −1.1% |
| 3 | Georgia | 93,849 | 92,588 | −1,261 | −1.3% |
| 4 | Oklahoma | 21,391 | 20,140 | −1,251 | −5.8% |
| 5 | South Carolina | 28,239 | 27,067 | −1,172 | −4.2% |
| 6 | Kentucky | 40,321 | 39,228 | −1,093 | −2.7% |
| 7 | Alabama | 24,753 | 23,678 | −1,075 | −4.3% |
| 8 | Nevada | 44,783 | 44,084 | −699 | −1.6% |
| 9 | Maryland | 34,604 | 34,028 | −576 | −1.7% |
| 10 | Kansas | 22,057 | 21,551 | −506 | −2.3% |
Source: final 2024 BLS QCEW annual area files. The comparison includes only jurisdictions with disclosed employment-change values.
The national increase of 31,563 jobs coexisted with declines in several of the largest warehouse states. California remained the largest state despite losing 2,653 jobs, while New Jersey remained eighth despite the largest disclosed decline. A state can therefore be large, concentrated, and shrinking at the same time.
Which states had the fastest warehouse job growth?
Louisiana had the fastest disclosed percentage growth at 54.6%, followed by Alaska at 38.7% and Rhode Island at 18.5%. Percentage growth must be read beside the starting base: Alaska’s rate represented 135 added jobs, while New York’s lower 8.8% rate represented 4,718.
| Rank | State | 2023 jobs | Jobs added | 2024 jobs | Growth |
|---|---|---|---|---|---|
| 1 | Louisiana | 7,986 | +4,358 | 12,344 | +54.6% |
| 2 | Alaska | 349 | +135 | 484 | +38.7% |
| 3 | Rhode Island | 1,761 | +326 | 2,087 | +18.5% |
| 4 | South Dakota | 2,689 | +354 | 3,043 | +13.2% |
| 5 | Nebraska | 7,667 | +852 | 8,519 | +11.1% |
| 6 | New York | 53,912 | +4,718 | 58,630 | +8.8% |
| 7 | Virginia | 40,421 | +3,480 | 43,901 | +8.6% |
| 8 | Montana | 385 | +33 | 418 | +8.6% |
| 9 | Tennessee | 51,273 | +3,681 | 54,954 | +7.2% |
| 10 | New Mexico | 4,909 | +352 | 5,261 | +7.2% |
Source: final 2024 BLS QCEW annual area files. Starting employment is reconstructed from BLS-published current employment and absolute change.
Louisiana is the rare case that ranks near the top under both lenses. It added 4,358 jobs, the second-largest absolute gain, while growing from an implied 7,986 jobs in 2023 to 12,344 in 2024. The table describes the size of the change, not its cause. BLS notes that shifts can reflect openings, closings, expansions, contractions, relocation, reclassification, or changes in how multi-unit employers report.
Which states have the highest warehouse industry pay?
New Hampshire had the highest disclosed average annual pay at $89,023, followed by Massachusetts at $72,661 and California at $68,149. Across the 49 jurisdictions with disclosed pay, the median state figure was $52,822, below the job-weighted national average of $55,896.
| Rank | State | Covered jobs | Avg. annual pay | Avg. weekly pay | vs. U.S. | Pay change |
|---|---|---|---|---|---|---|
| 1 | New Hampshire | 3,371 | $89,023 | $1,712 | +59.3% | +20.1% |
| 2 | Massachusetts | 14,949 | $72,661 | $1,397 | +30.0% | +3.8% |
| 3 | California | 243,656 | $68,149 | $1,311 | +21.9% | +14.3% |
| 4 | Colorado | 25,718 | $62,249 | $1,197 | +11.4% | +6.5% |
| 5 | Louisiana | 12,344 | $61,969 | $1,192 | +10.9% | −9.2% |
| 6 | Washington | 33,255 | $61,344 | $1,180 | +9.7% | +3.2% |
| 7 | New York | 58,630 | $61,178 | $1,177 | +9.4% | +11.4% |
| 8 | Utah | 11,814 | $60,614 | $1,166 | +8.4% | +6.4% |
| 9 | Minnesota | 17,299 | $59,385 | $1,142 | +6.2% | +5.7% |
| 10 | Oregon | 17,663 | $59,329 | $1,141 | +6.1% | +7.8% |
Source: final 2024 BLS QCEW annual area files; the comparison with the U.S. average and the median across disclosed jurisdictions are our calculations.
New Hampshire’s figure needs its denominator. The industry averaged only 3,371 covered jobs there, so the statewide mean can be more sensitive to employer mix, occupation mix, bonuses, hours, and reporting changes than the much larger California or Texas averages. QCEW average annual pay is total annual wages divided by annual-average employment. It is not an occupation-specific warehouse-worker salary and it is not adjusted for state cost of living.
Where is warehousing employment most concentrated?
Nevada had the highest disclosed employment location quotient at 2.33, followed by Delaware at 2.13 and Mississippi at 1.81. An LQ above 1.00 means Warehousing and Storage accounts for a larger share of employment in that state than it does nationally; it does not mean the state has the most warehouse jobs.
| LQ rank | State | Employment LQ | Covered jobs | U.S. job share | Job rank |
|---|---|---|---|---|---|
| 1 | Nevada | 2.33 | 44,084 | 2.33% | 14 |
| 2 | Delaware | 2.13 | 12,384 | 0.65% | 34 |
| 3 | Mississippi | 1.81 | 25,736 | 1.36% | 23 |
| 4 | Indiana | 1.74 | 67,598 | 3.57% | 9 |
| 5 | Pennsylvania | 1.67 | 122,432 | 6.47% | 3 |
| 6 | Kentucky | 1.62 | 39,228 | 2.07% | 17 |
| 7 | Georgia | 1.56 | 92,588 | 4.89% | 6 |
| 8 | New Jersey | 1.48 | 76,866 | 4.06% | 8 |
| 9 | Ohio | 1.42 | 95,450 | 5.04% | 5 |
| 10 | Tennessee | 1.38 | 54,954 | 2.90% | 11 |
Source: BLS-published 2024 employment location quotients and annual-average employment; ranks and national job shares are our calculations.
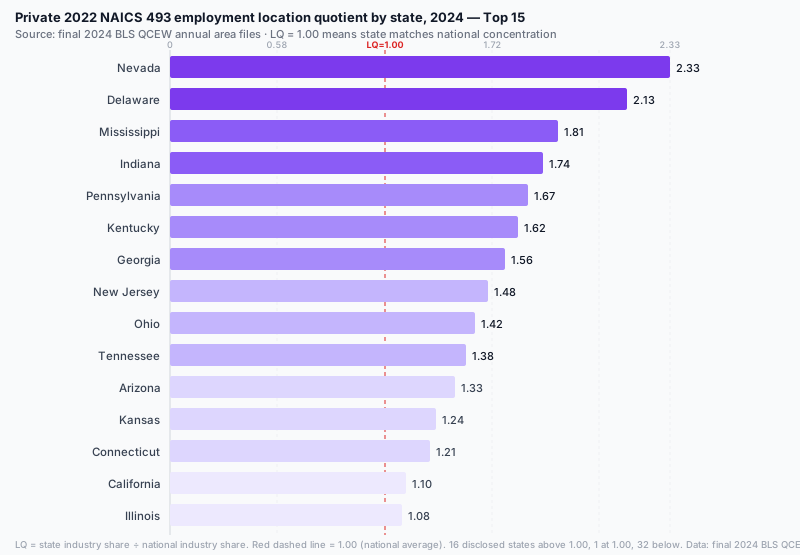
BLS defines a location quotientas the ratio of a local industry’s employment share to that industry’s national employment share:
- 1.00 means the state matches the national concentration.
- 2.00 means the industry’s state employment share is twice the national share.
- 0.50 means the state share is half the national share.
Sixteen disclosed states were above 1.00, Texas was exactly 1.00, and 32 were below 1.00. California illustrates why LQ and scale must stay separate: it ranked first in jobs but only 14th in concentration, while Delaware ranked second in concentration with fewer than 13,000 jobs.
What does the jobs-per-establishment ratio reveal?
Private 2022 NAICS 493 averaged 83.15 covered jobs per reporting establishment nationwide in 2024, down 1.47% from an implied 84.38 in 2023. Arizona had the highest disclosed state ratio at 148.8, followed by Maryland at 137.8 and Connecticut at 132.8.
| Rank | State | Establishments | Covered jobs | Jobs per estab. | Job rank |
|---|---|---|---|---|---|
| 1 | Arizona | 353 | 52,515 | 148.8 | 13 |
| 2 | Maryland | 247 | 34,028 | 137.8 | 18 |
| 3 | Connecticut | 188 | 24,960 | 132.8 | 25 |
| 4 | Indiana | 546 | 67,598 | 123.8 | 9 |
| 5 | Oklahoma | 186 | 20,140 | 108.3 | 28 |
| 6 | Pennsylvania | 1,139 | 122,432 | 107.5 | 3 |
| 7 | Ohio | 974 | 95,450 | 98.0 | 5 |
| 8 | Delaware | 127 | 12,384 | 97.5 | 34 |
| 9 | Wyoming | 19 | 1,806 | 95.1 | 46 |
| 10 | Illinois | 858 | 79,921 | 93.1 | 7 |
Source: jobs per establishment is our calculation from BLS annual-average employment and establishment counts; prior-year national values are reconstructed from BLS-published changes.
This ratio is useful for comparing the relationship between two published measures, but its name is easy to overread. Arizona’s 148.8 does not establish that the average physical warehouse building employs 149 people. The national ratio fell because establishments grew faster than employment: establishments increased 3.2%, while jobs increased 1.7%.
Why does this 2026 report use final 2024 data instead of preliminary 2025 data?
As of , 2024 is the latest complete and final QCEW annual benchmark, while 2025 annual averages remain preliminary. BLS is scheduled to finalize 2025 quarterly and annual data with the first-quarter 2026 release on August 28, 2026, at 10:00 a.m. Eastern Time.
BLS publishes preliminary annual averages with the fourth-quarter release, then finalizes that reference year when first-quarter data for the following year are released. The agency’s release calendar states this sequence and the August 28 date. Using final 2024 data keeps every state, chart, and derived measure on the same finalized basis.
Update policy
The next full rebuild should occur after the August 28, 2026 QCEW release is checked and the 2025 annual files are confirmed final. That rebuild should re-download all 52 area files, preserve the old 2024 release, rerun disclosure checks, regenerate state positions and charts, update the source manifest and checksum, and record every changed value in a version history. The visible “Last verified” date will change only after those checks are actually completed.
Version history
Version 1.0 — : Initial release using final 2024 QCEW annual data.
What are the limits of these warehouse statistics?
The dataset is broad but deliberately narrow in meaning: it covers private 2022 NAICS 493 reporting establishments and UI-covered payroll jobs, not the entire physical or occupational warehouse economy. Two jurisdictions have protected values, state sums do not exactly reproduce the national control row, and one-year changes cannot identify cause.
| Limitation | Why it matters |
|---|---|
| Two suppressed jurisdictions | D.C. and Hawaii retain establishment counts, but employment, wage, LQ, and employment-change fields are ND. |
| National reconciliation | The disclosed state/D.C. rows sum to 1,890,972 jobs, 1,182 below the U.S. total; BLS totals include suppressed components and annual averages are calculated from underlying monthly or quarterly values. |
| Industry, not occupation | The 1,892,154 jobs include every occupation employed at private 2022 NAICS 493 establishments, not only material movers, forklift operators, or other warehouse occupations. |
| Filled jobs, not unique people | A person with two covered jobs can appear twice; self-employed workers and other groups outside unemployment-insurance coverage are excluded. |
| Establishments, not buildings | The 22,757 figure is an annual-average reporting-unit count. Multi-establishment reporting prevents it from serving as a building inventory. |
| Nominal average pay | The $55,896 national figure is not a median and is not adjusted for cost of living, hours, occupation mix, bonuses, or full-time/part-time composition. |
| One-year changes are descriptive | The +54.6% Louisiana result and every other change can reflect openings, closings, expansions, contractions, reporting changes, or reclassification; this dataset does not identify cause. |
| No physical-market measures | The data do not report square footage, vacancy, rents, pallet positions, dock-door count, throughput, inventory, automation, revenue, or productivity. |
| Annual averages smooth timing | Employment averages 12 monthly levels and establishments average four quarterly counts, so the figures are not year-end snapshots. |
Source: our QA reconciliation, the BLS annual bulletin, QCEW questions and definitions, and the Census NAICS definition.
The limits are not reasons to discard the dataset. They are the conditions for quoting it accurately. A state comparison becomes misleading only when an industry establishment is relabeled as a building, a filled job is relabeled as a person, or an industry average is relabeled as an occupation salary.
Frequently asked questions about warehouse statistics by state
The answers below resolve the most common ambiguities in the dataset. Every answer repeats the relevant year and scope so it can stand on its own.
- What state has the most warehouse jobs?
- California had the most disclosed private Warehousing and Storage employment in 2024, with 243,656 annual-average covered jobs under 2022 NAICS 493. Texas ranked second with 169,621, and Pennsylvania ranked third with 122,432.
- What state has the most warehouse establishments?
- California had the most private 2022 NAICS 493 establishments in 2024, with an annual average of 2,685. Texas ranked second with 2,053, and Florida ranked third with 1,208.
- How many warehouse jobs are in the United States?
- The private U.S. Warehousing and Storage industry averaged 1,892,154 covered jobs in 2024. This is an industry payroll-job measure, not a count of unique people or warehouse occupations across every industry.
- How many warehouse establishments are in the United States?
- The private U.S. Warehousing and Storage industry averaged 22,757 establishments in 2024. Because BLS averages four quarterly establishment counts, the figure is not a year-end count and does not equal the number of warehouse buildings.
- Does one QCEW establishment equal one warehouse building?
- No. A QCEW establishment is usually a worksite or economic unit classified by its predominant activity, but some multi-location firms can report on a consolidated basis. The establishment count is a consistent economic measure, not a physical-building inventory.
- Is average annual pay the average salary of a warehouse worker?
- No. The national figure of $55,896 covers all payroll jobs at private 2022 NAICS 493 establishments and is calculated from total wages divided by annual-average employment. It is not an occupation-specific median, an hourly wage, or a cost-of-living-adjusted salary.
- Why are D.C. and Hawaii shown as ND?
- ND means not disclosed. BLS published annual-average establishment counts of 23 for D.C. and 56 for Hawaii but withheld their detailed employment and wage values to protect employer confidentiality; the unavailable fields should not be interpreted as observed zeros.
- Is 2025 warehouse data available?
- Preliminary 2025 QCEW annual averages are available, but final 2025 annual data are scheduled to become available with the first-quarter 2026 release on August 28, 2026. This report uses 2024 because it was the latest final annual baseline when the data were verified on July 21, 2026.
- What does an employment location quotient above 1.00 mean?
- It means Warehousing and Storage accounts for a larger share of employment in that state than it does nationally. Nevada's 2.33 LQ means the state's industry employment share was 2.33 times the national share; it does not mean Nevada had 2.33 times as many jobs or 2.33 times the warehouse capacity.
- Does NAICS 493 include self-storage facilities?
- No. The Census Bureau classifies renting or leasing self-storage space under NAICS 531130, not NAICS 493110. NAICS 493 covers operations whose substantive activity is warehousing or storage of goods, including general, refrigerated, farm-product, and other specialized storage.
- Why can other 'warehouse counts' be much higher or lower?
- Different datasets can count different things: physical properties, business listings, map locations, companies, self-storage sites, or QCEW establishments. Without a shared definition, period, geography, and deduplication method, those counts are not interchangeable with the 22,757 annual-average private 2022 NAICS 493 establishments in this report.
Primary sources
- U.S. Bureau of Labor Statistics — Employment and Wages, Annual Averages 2024
- U.S. Bureau of Labor Statistics — QCEW Open Data Access
- U.S. Bureau of Labor Statistics — QCEW Questions and Answers
- U.S. Bureau of Labor Statistics — QCEW Location Quotient Details
- U.S. Census Bureau — 2022 NAICS Manual (NAICS 493 definition)
- U.S. Bureau of Labor Statistics — QCEW Release Calendar